Organic Carbon Stocks in 15 Dynamic Turkish Coastal Wetlands
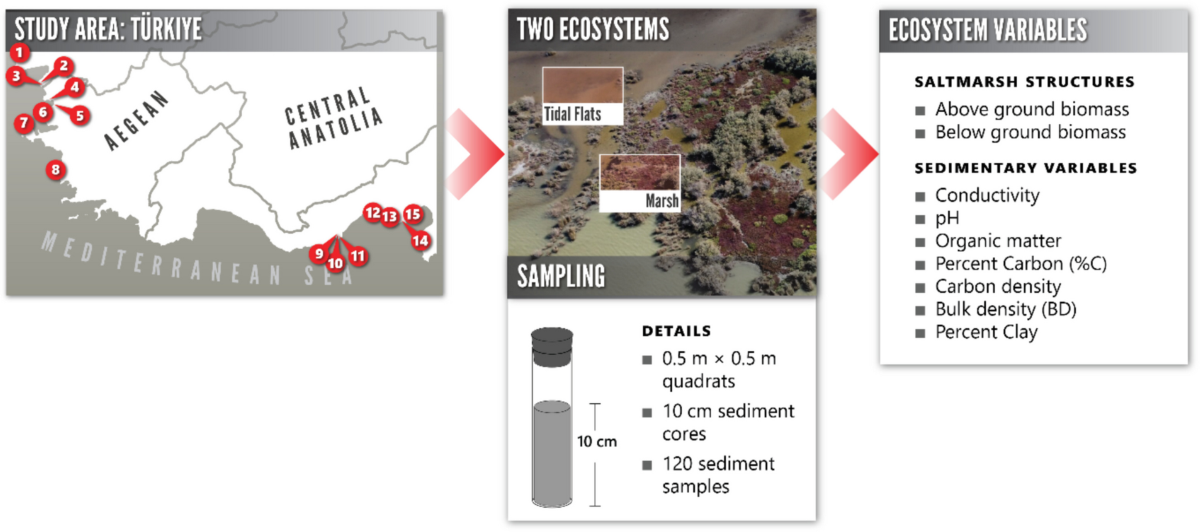
Conducted under METU IMS & EKOSAM across 15 major coastal wetlands in Türkiye (120 sampling quadrats: 71 vegetated salt marsh plots and 49 unvegetated tidal flat plots). This landmark inventory quantified soil organic carbon (SOC) and above/below-ground plant biomass carbon pools, demonstrating how vegetation community structure, soil bulk density, and regional hydro-climatic gradients govern Mediterranean blue carbon sequestration.
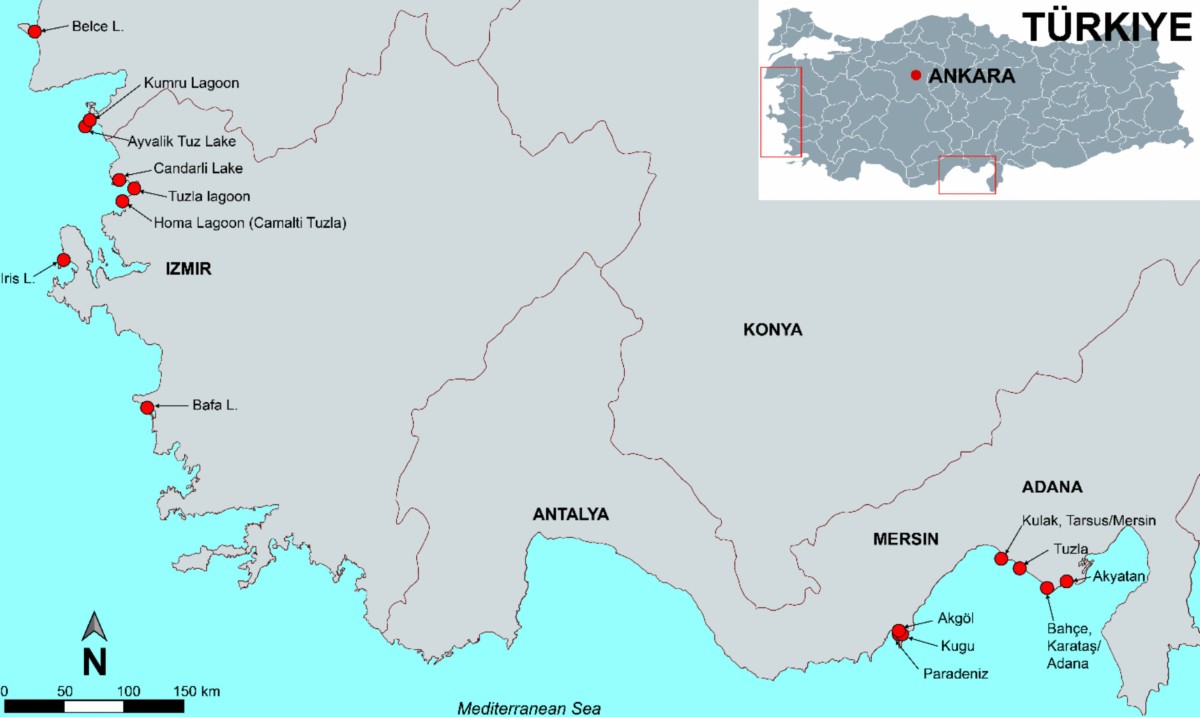
Spatial Distribution of 15 Sampled Coastal Wetlands Across Aegean & Mediterranean Türkiye
Geographical map of the 15 wetland systems sampled across the Aegean and Mediterranean coastlines of Türkiye, spanning river deltas, coastal lagoons, and salt marshes.
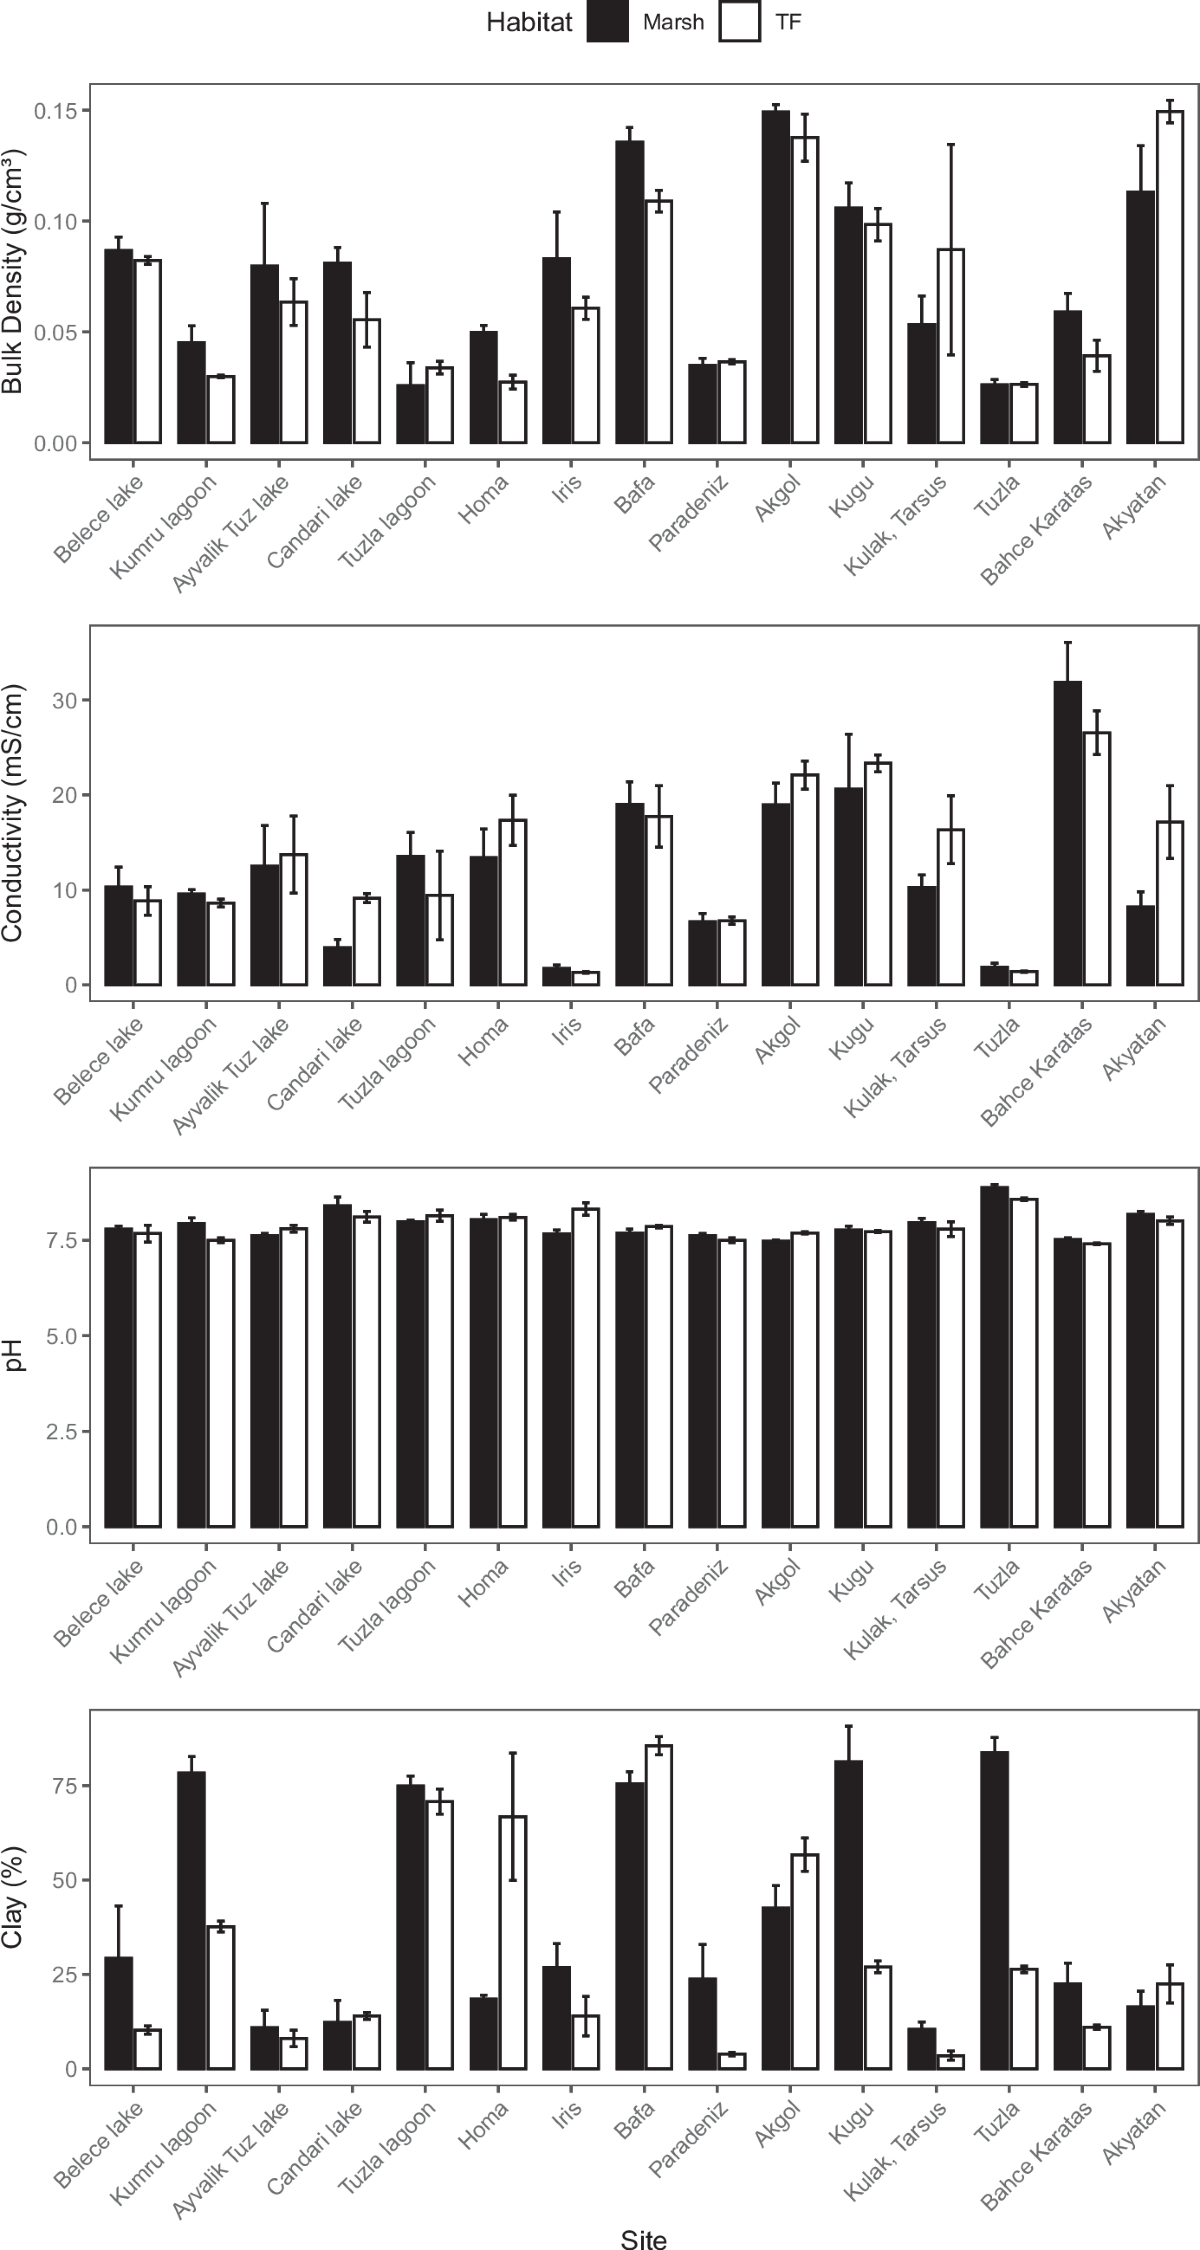
Comparison of Organic Carbon Density Across Vegetated Marshes & Unvegetated Tidal Flats
Distribution of soil organic carbon (SOC) and plant biomass carbon stocks across the 15 Turkish wetlands comparing 71 vegetated salt marsh quadrats with 49 unvegetated tidal flat quadrats.
Above-Ground and Below-Ground Carbon Partitioning Across Dominant Marsh Taxa
Partitioning of organic carbon between above-ground shoots and below-ground root/rhizome networks across dominant Mediterranean halophytes and brackish marsh species.
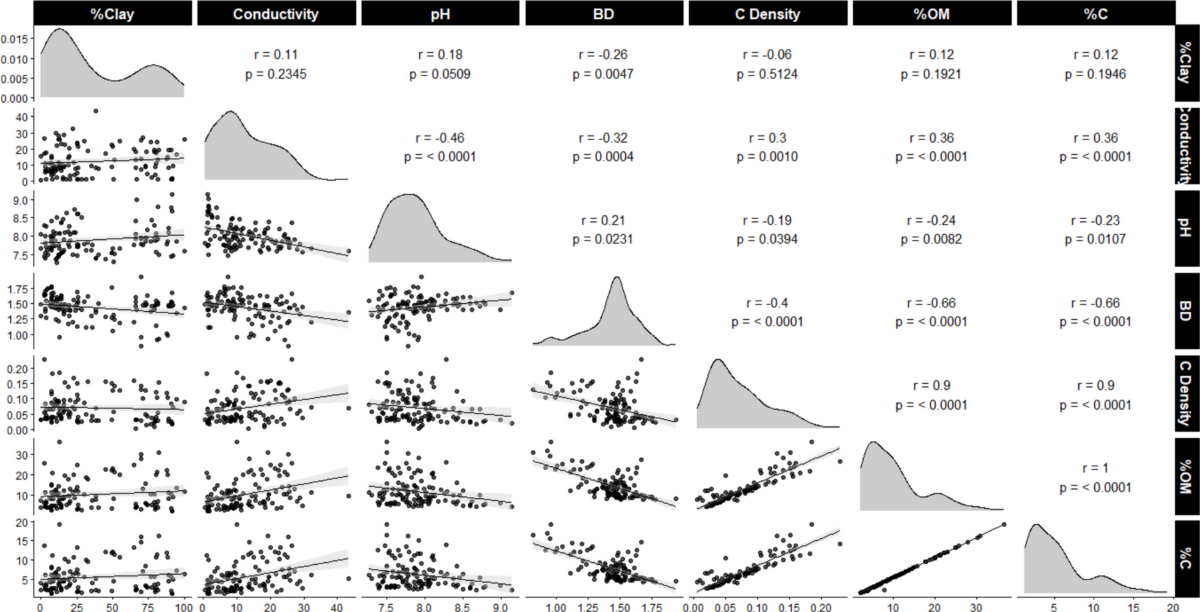
Ordination and Structural Relationships Governing Coastal Carbon Storage
Multivariate analysis linking soil texture, salinity, bulk density, and hydro-climatic variables to total ecosystem carbon stocks in Turkish coastal wetlands.
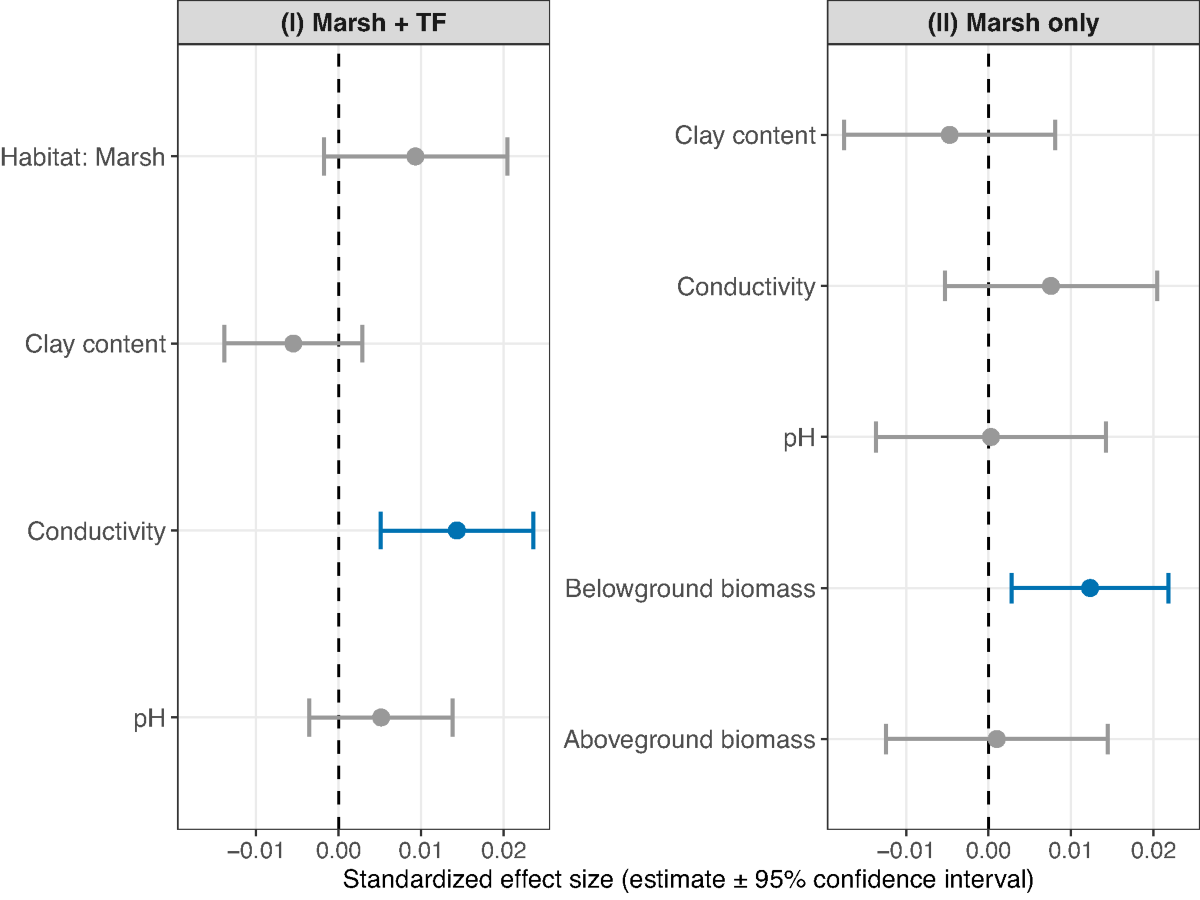
Ecosystem-Level Blue Carbon Synthesis & Management Framework for Türkiye
Integrative comparison of Turkish coastal wetland carbon stocks against global and Mediterranean benchmarks, highlighting conservation priorities for vegetated marshes.
Dual-Latitude Oligohaline Warming Mesocosms
Alongside field inventories, Dr. Billah co-led a synchronized 4,000-L experimental mesocosm study across two contrasting climate zones in Türkiye (Ankara continental vs. Mersin warm Mediterranean) to evaluate how +4 °C warming and oligohaline salinity shifts impact the submerged macrophyte Stuckenia pectinata, epiphyton, and phytoplankton (Aquatic Botany, 2025; presented at ASLO-SIL 2026 Session SS082P).
Salt Marsh Restoration Engineering & Microbial Carbon-Cycling Pathways
Conducted at the University of Bologna (CIRSA Ravenna) and the Venice Lagoon in collaboration with Prof. Laura Airoldi and Dr. Davide De Battisti, alongside global synthesis work with UPM Malaysia. Examines how bio-engineered confinement barriers and excavated tidal creeks recover plant traits, macrofaunal communities, and sediment bacterial carbon-fixation pathways compared to natural marshes.
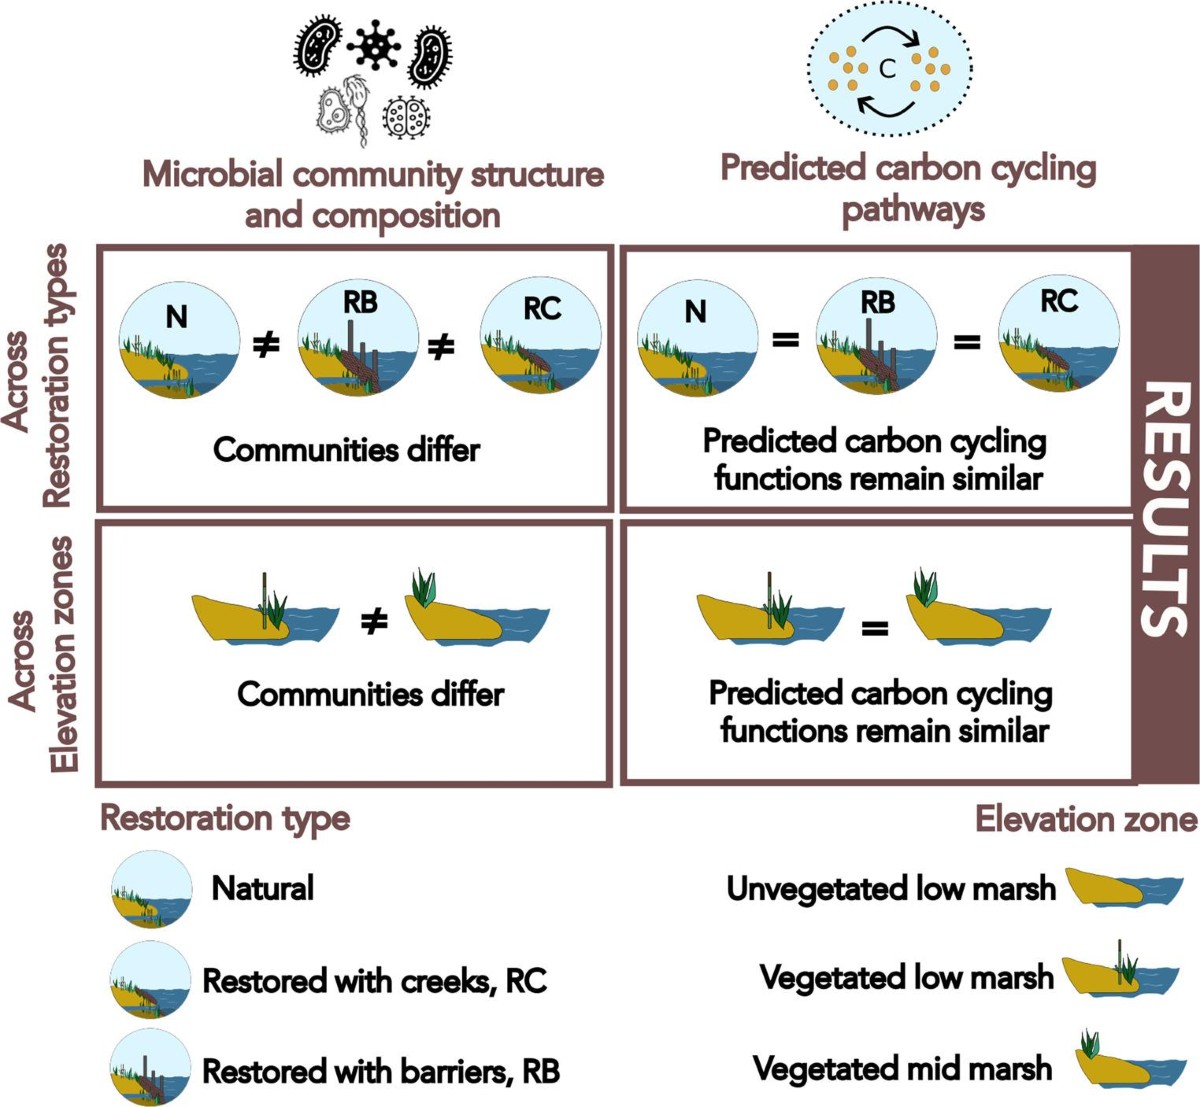
Natural vs. Restored Salt Marshes: Sediment Microbiome & Carbon Cycling
Conceptual and empirical overview comparing natural salt marshes, barrier-restored marshes, and creek-restored marshes in the Venice Lagoon, Italy.
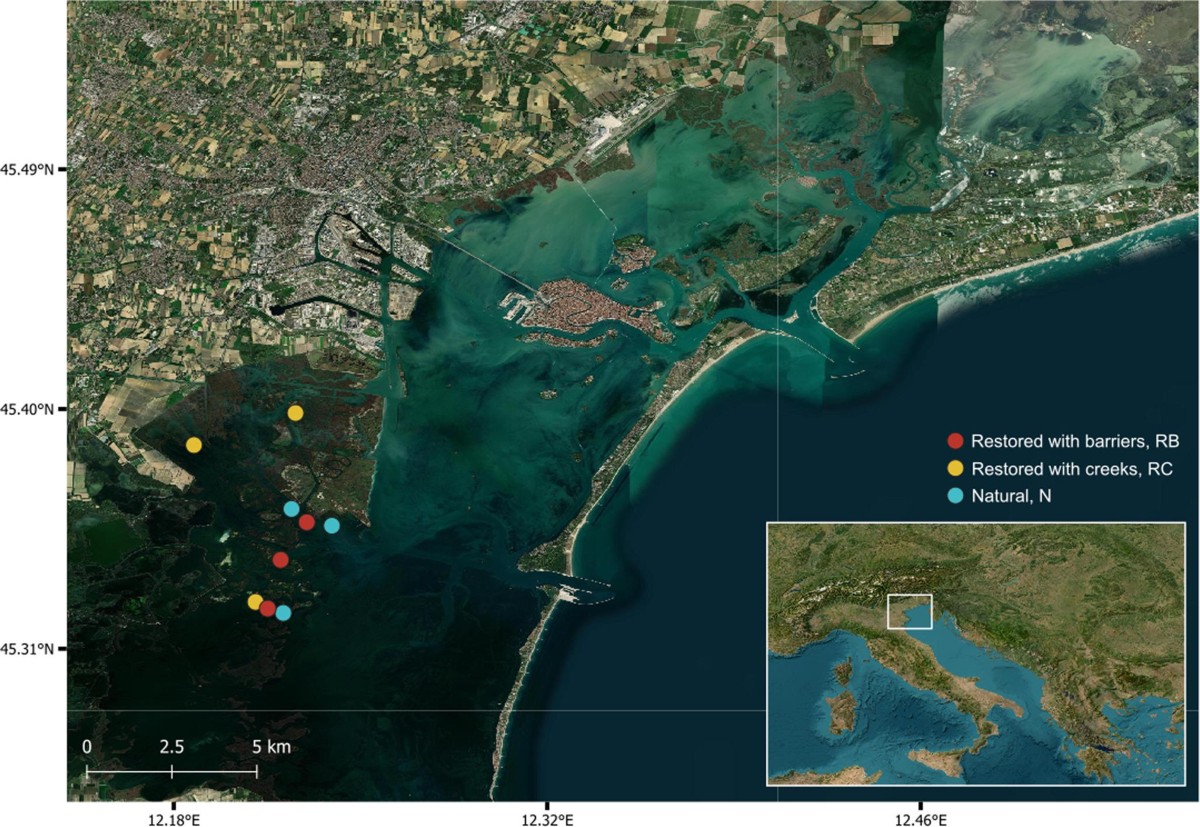
Multi-Site Sampling Network Across Natural and Reconstructed Marshes in the Venice Lagoon
Locations of natural reference salt marshes and engineered restoration marshes (with and without artificial tidal creeks) sampled across the Venice Lagoon.
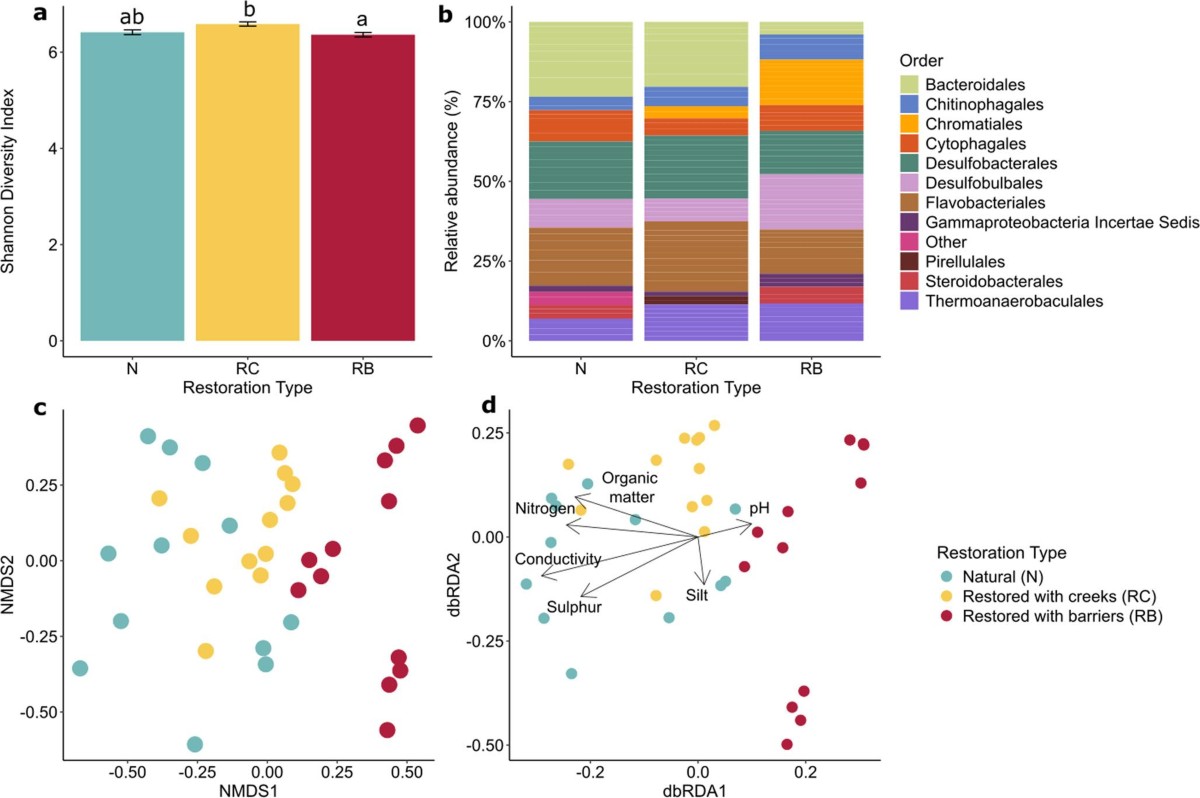
Bacterial Community Composition and Carbon-Fixation Pathway Abundance
Taxonomic relative abundance and functional gene profiles regulating organic matter decomposition and carbon cycling in Venice Lagoon marsh sediments.
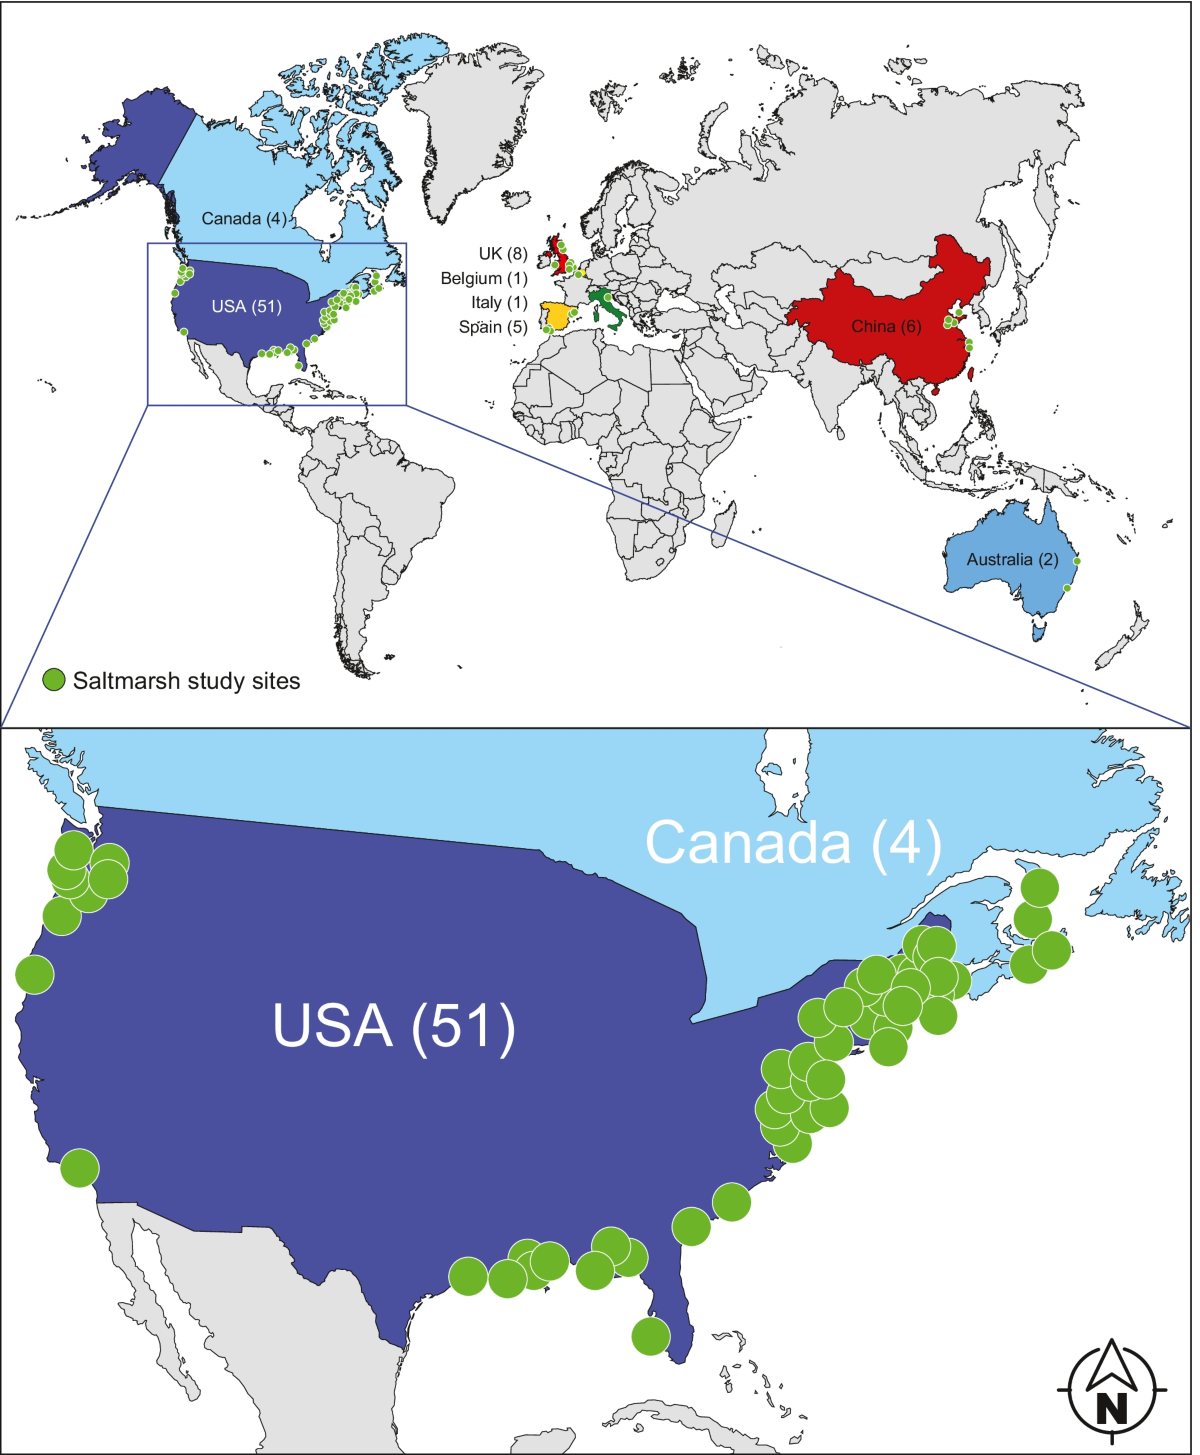
Global Synthesis of Salt Marsh Restoration Engineering & Hydrological Reconnection
Framework of ecological engineering techniques (managed realignment, sediment nourishment, wave-break structures, and halophyte transplantation) from Billah et al. (2022, 132+ citations).
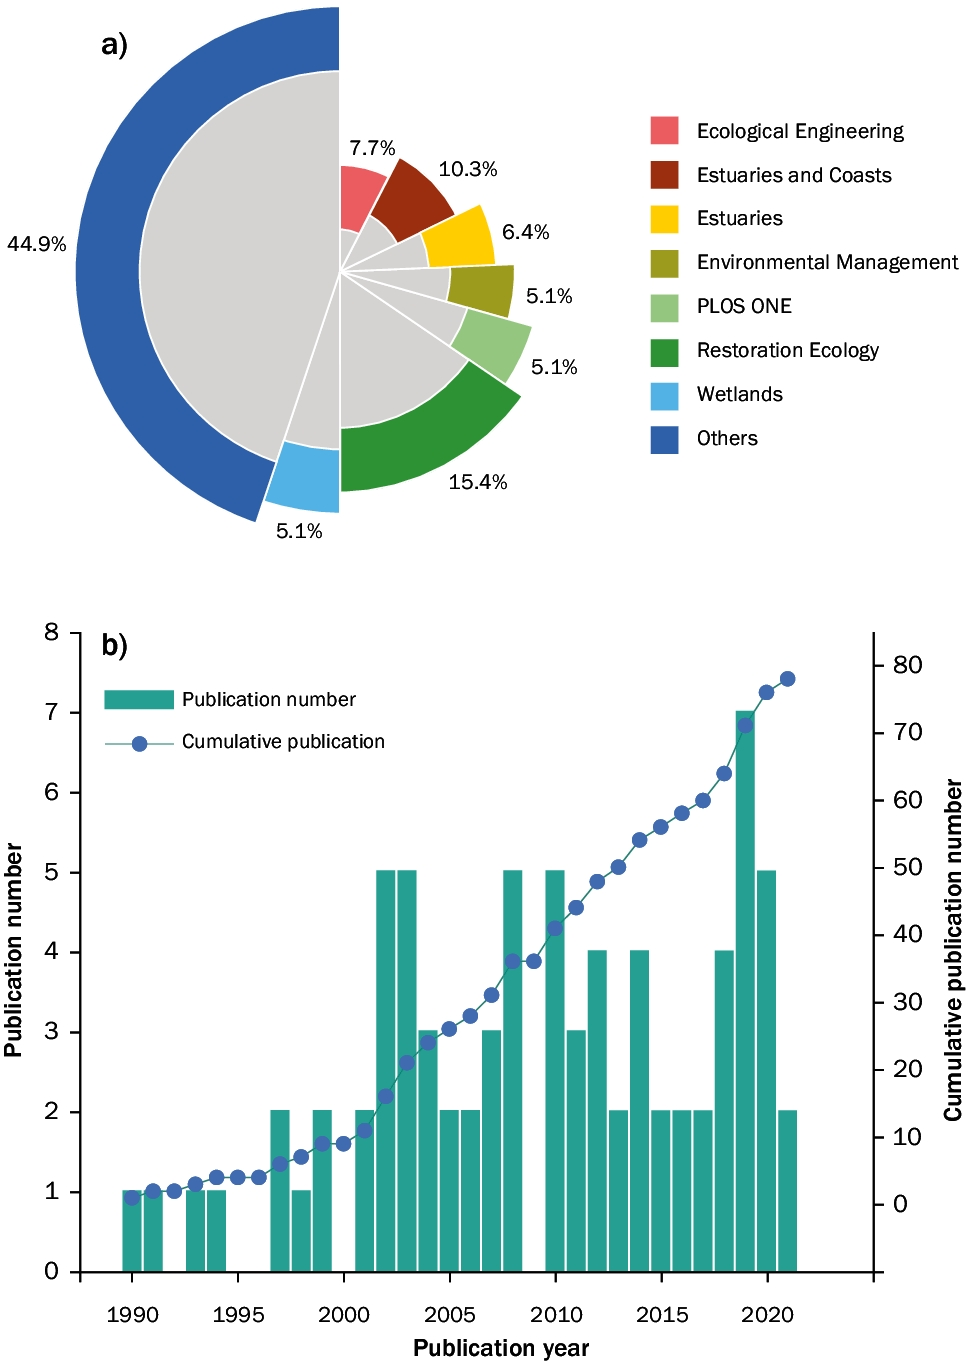
Functional Trajectory and Recovery Timeline of Restored Coastal Salt Marshes
Evaluation criteria for assessing hydrological, biogeochemical, floristic, and macrofaunal recovery following coastal salt marsh restoration.
Marsh-to-Mangrove Eddy-Covariance CO2 & CH4 Fluxes
Expanding coastal wetland carbon research to North America, Dr. Billah co-authored a 2026 study in Frontiers in Ecology and Evolution with Florida International University (FIU) researchers quantifying ecosystem-scale carbon dioxide and methane fluxes across a climate-driven coastal marsh-to-mangrove transition zone in the Florida Everglades.
Dietary Microplastic Biomarkers in Rainbow Trout & Sundarbans Trophic Transfer
Combining experimental aquaculture toxicology at Atatürk University (Erzurum, Türkiye) with estuarine field surveys in the Sundarbans mangrove forest (Bangladesh) and global remediation syntheses with UW-Milwaukee.
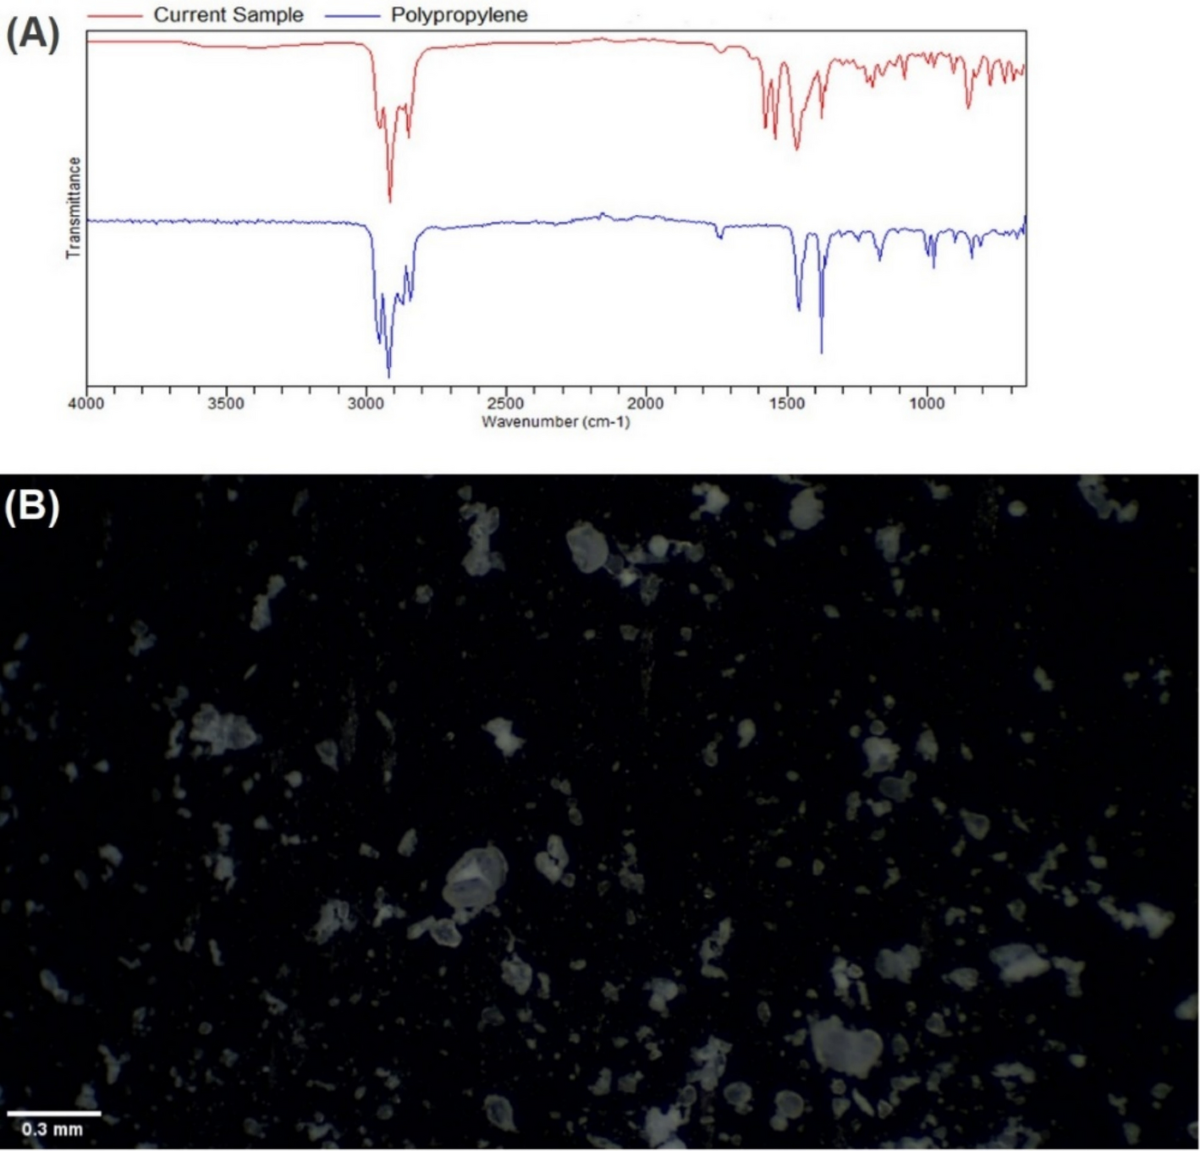
Experimental Design & Polypropylene Microplastic Characterization in Rainbow Trout
21-day dietary exposure setup testing 0%, 1%, 2%, and 4% polypropylene microplastics (PP-MPs) in juvenile rainbow trout (Oncorhynchus mykiss) at Atatürk University.
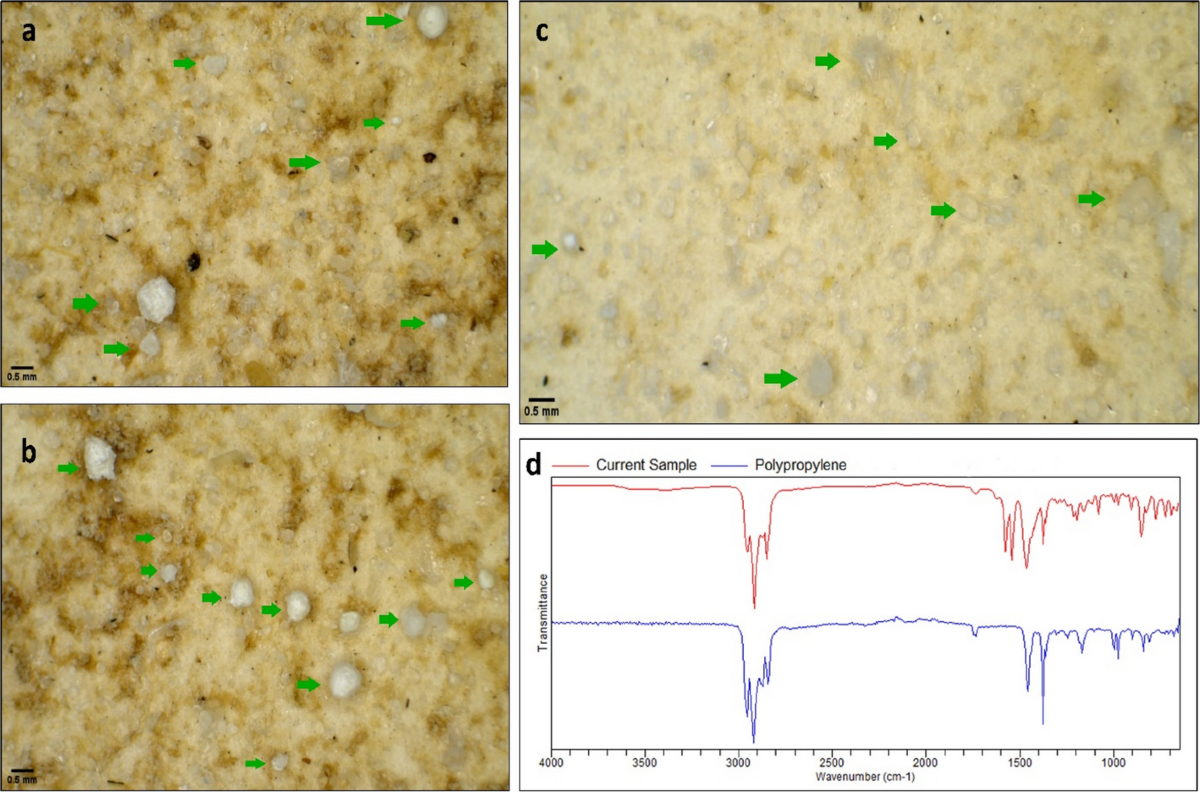
Genotoxic & Hematological Responses of Oncorhynchus mykiss to Dietary PP-MPs
Microscopic profiling of erythrocyte nuclear abnormalities (micronuclei, notched, blebbed, and binucleated cells) and malondialdehyde (MDA) lipid peroxidation across exposure groups.
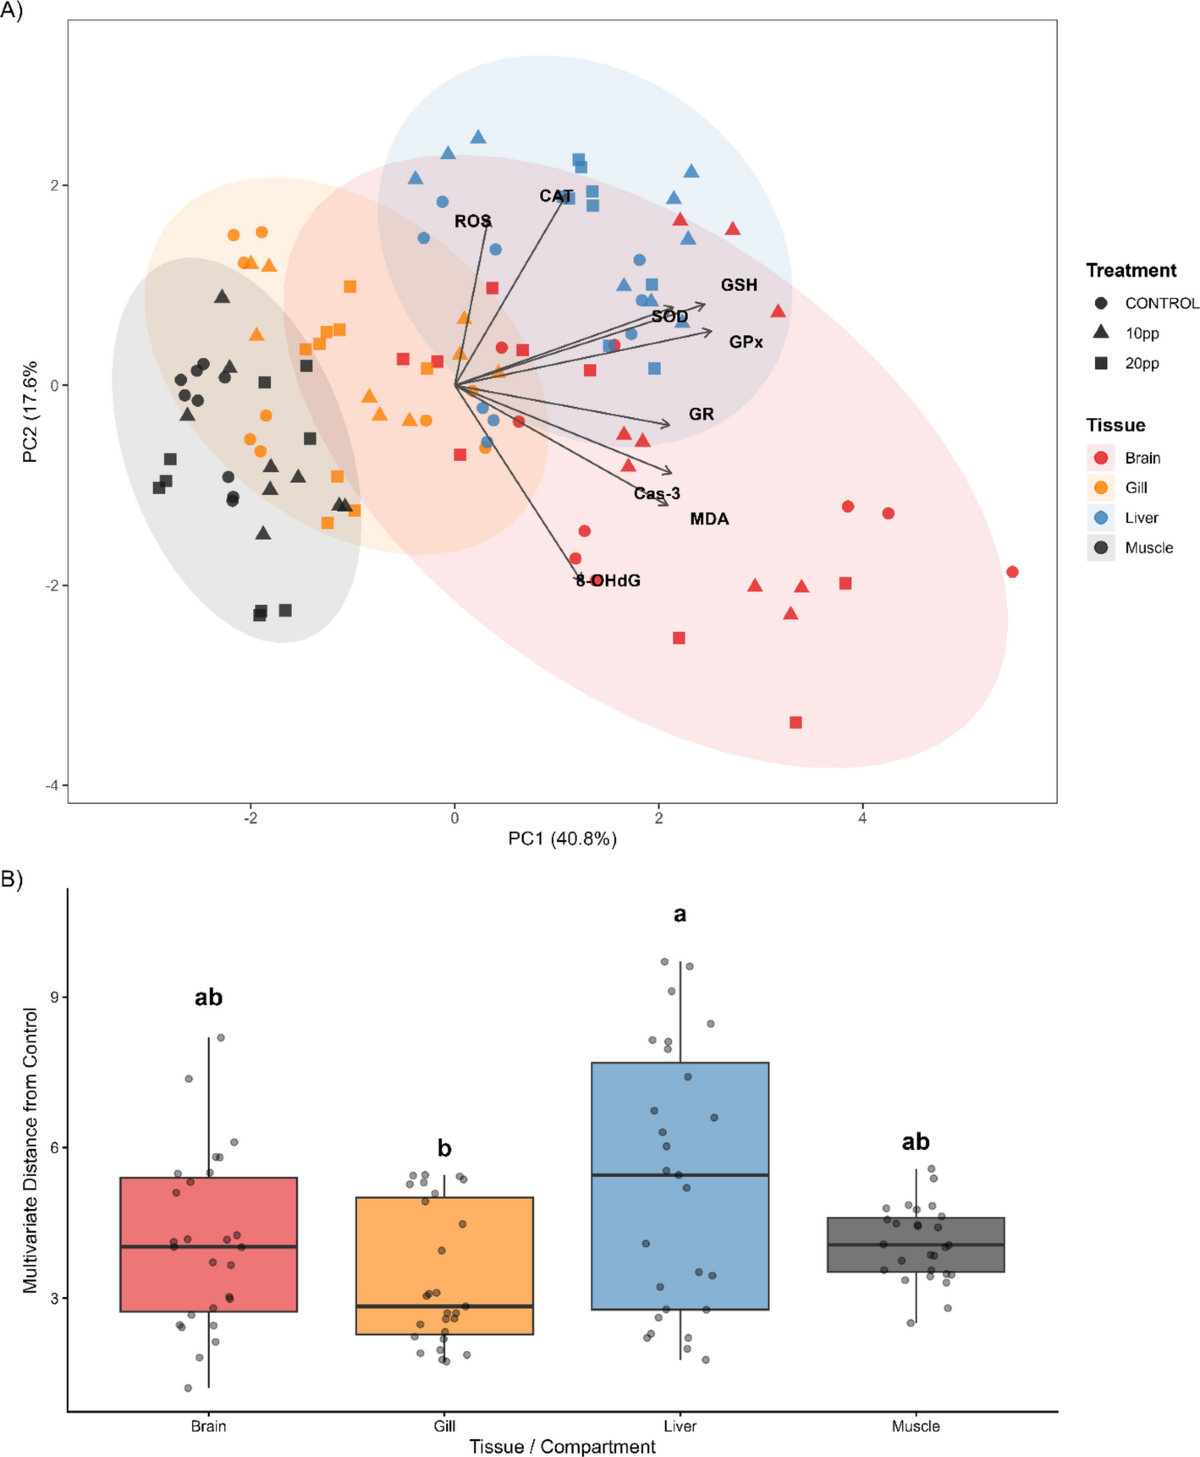
Dose-Dependent Histopathological Lesions in Rainbow Trout Organ Systems
Histological sections demonstrating lamellar fusion, hepatocyte vacuolation, sinusoidal congestion, and renal tubular degeneration under 2% and 4% dietary microplastic stress.
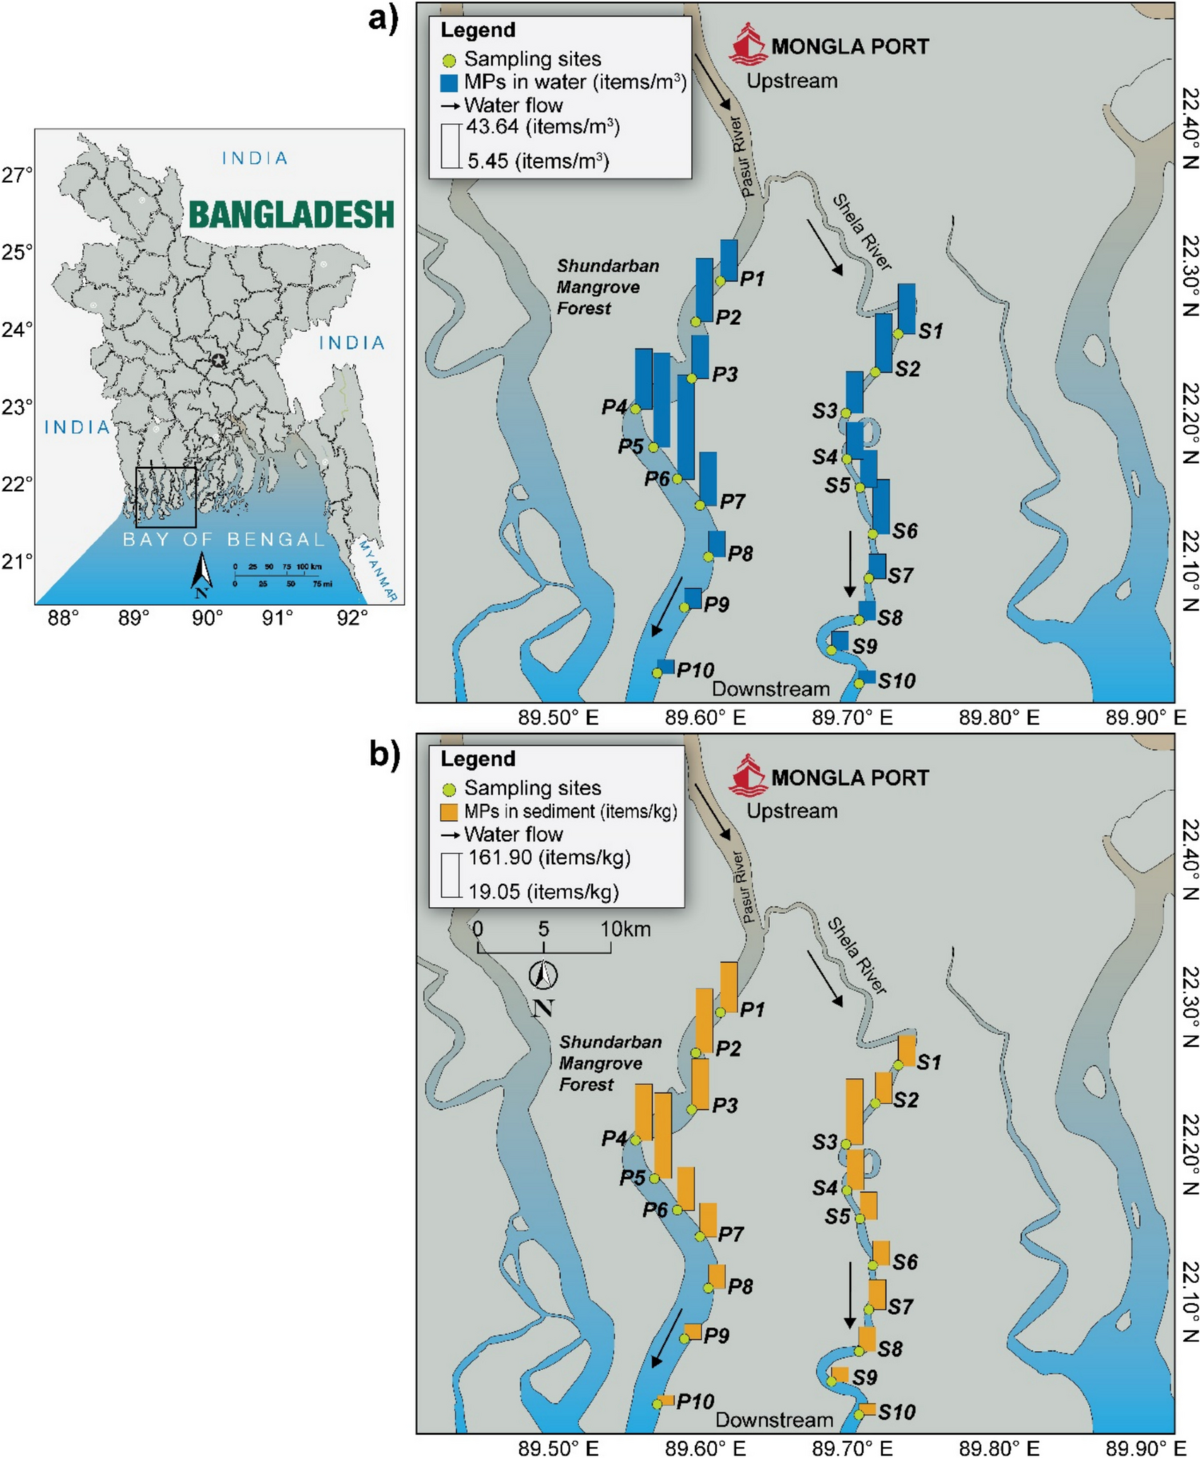
Sampling Stations Across the Sundarbans Mangrove Ecosystem, Bangladesh
Spatial map of surface water, riverbed sediment, and biota collection sites across the Sundarbans mangrove reserve.
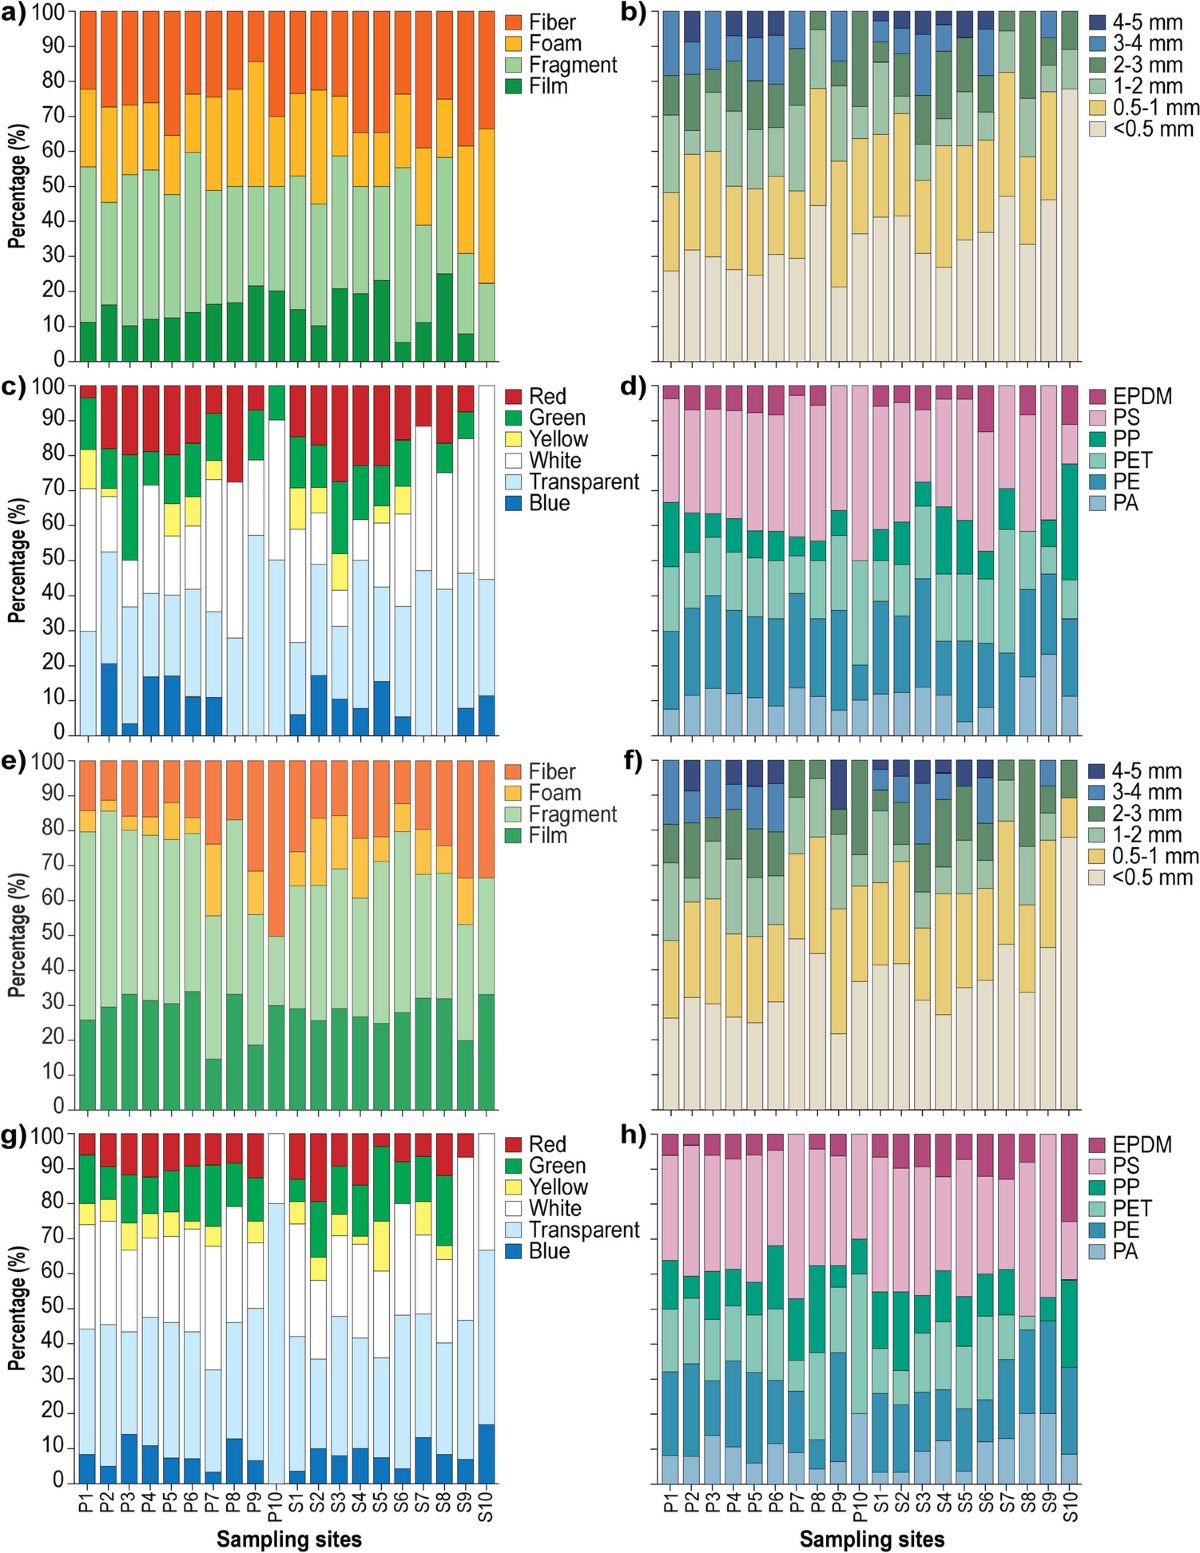
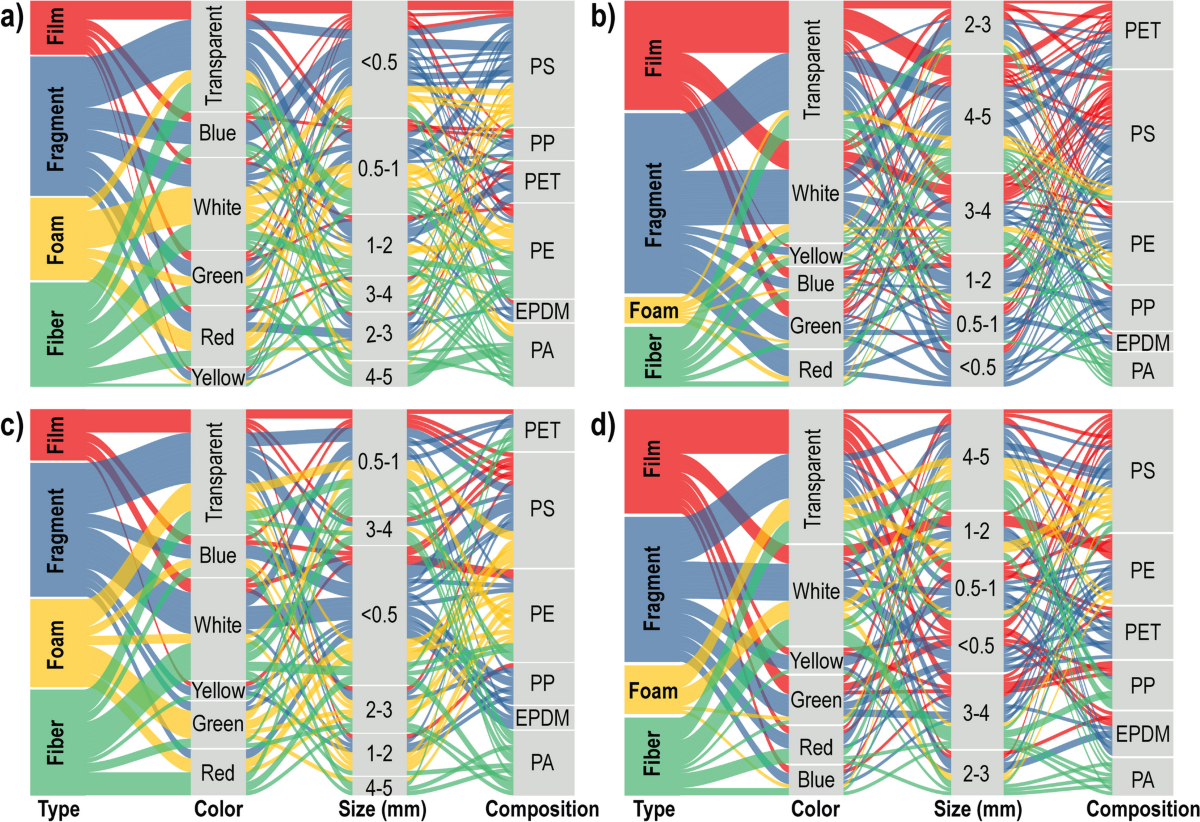
Abundance and Polymer Composition of Microplastics in Sundarbans Water & Sediment
Distribution of fibers, fragments, films, and microbeads identified via FTIR spectroscopy across estuarine water and benthic sediment compartments.
Microplastic Bioaccumulation Across 14 Commercial Fish and Crab Species
Species-specific gastrointestinal and tissue microplastic loads and Polymer Hazard Index (PHI) ecological risk evaluation in Sundarbans fishery resources.
Malaysian Mangrove Ecology, Setiu Lagoon Carbon & Osaka Bay Metal Speciation
Field studies and syntheses covering Malaysian mangrove biodiversity and blue carbon stocks (Peninsular Malaysia, Sarawak, and Setiu Lagoon), doctoral trace metal partitioning across 25 stations in Osaka Bay (Japan), and global PAH fate in mangrove sediments.
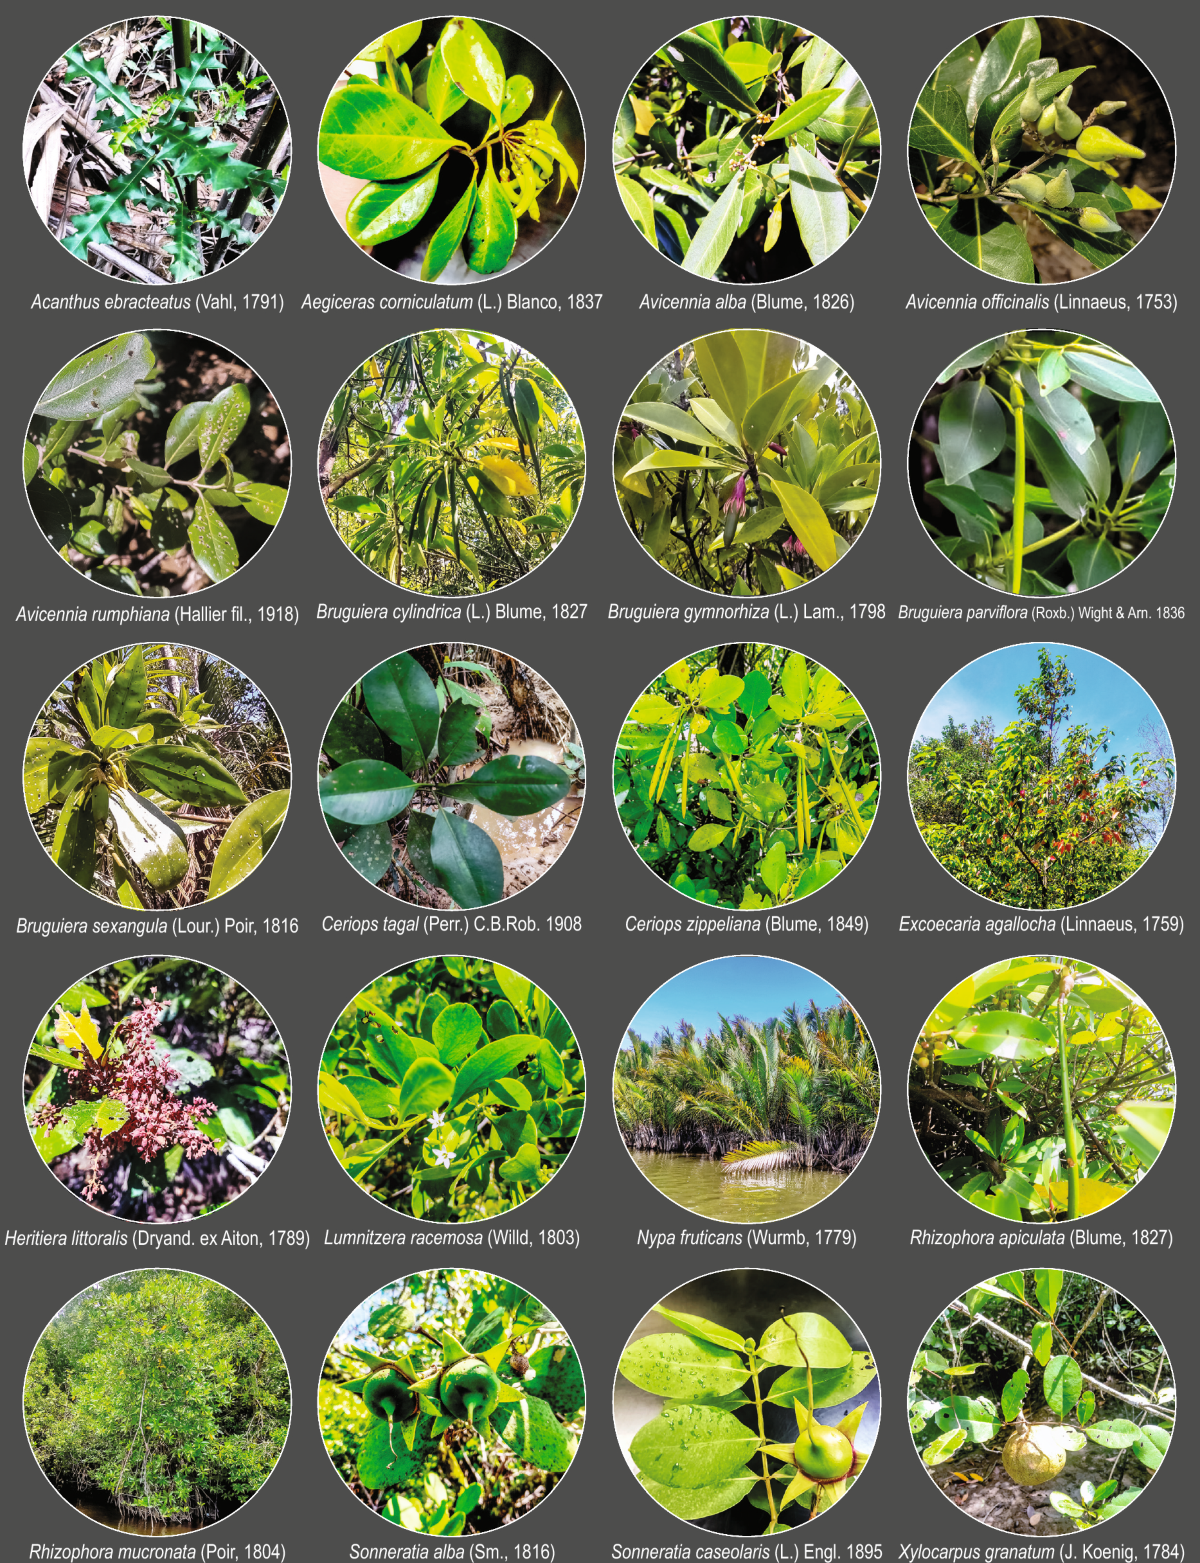
Geographical Distribution and Areal Extent of Mangrove Forests Across Malaysia
Comprehensive cartographic overview of mangrove ecosystems across Peninsular Malaysia, Sabah, and Sarawak (Borneo).
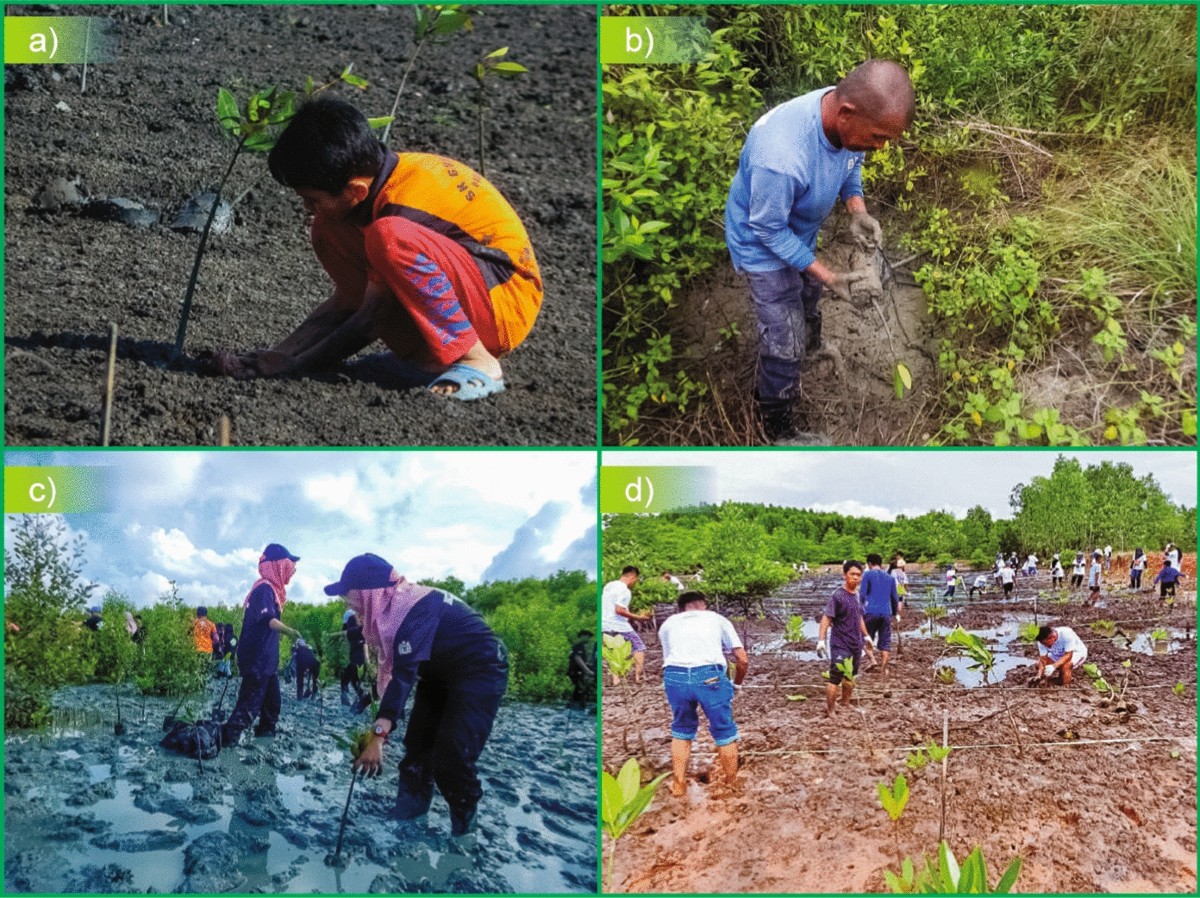
In-Situ Mangrove Restoration and Shoreline Stabilization in Malaysia
Photographic documentation of mangrove replanting, coastal protection structures, and intertidal habitat recovery in Malaysian estuaries.
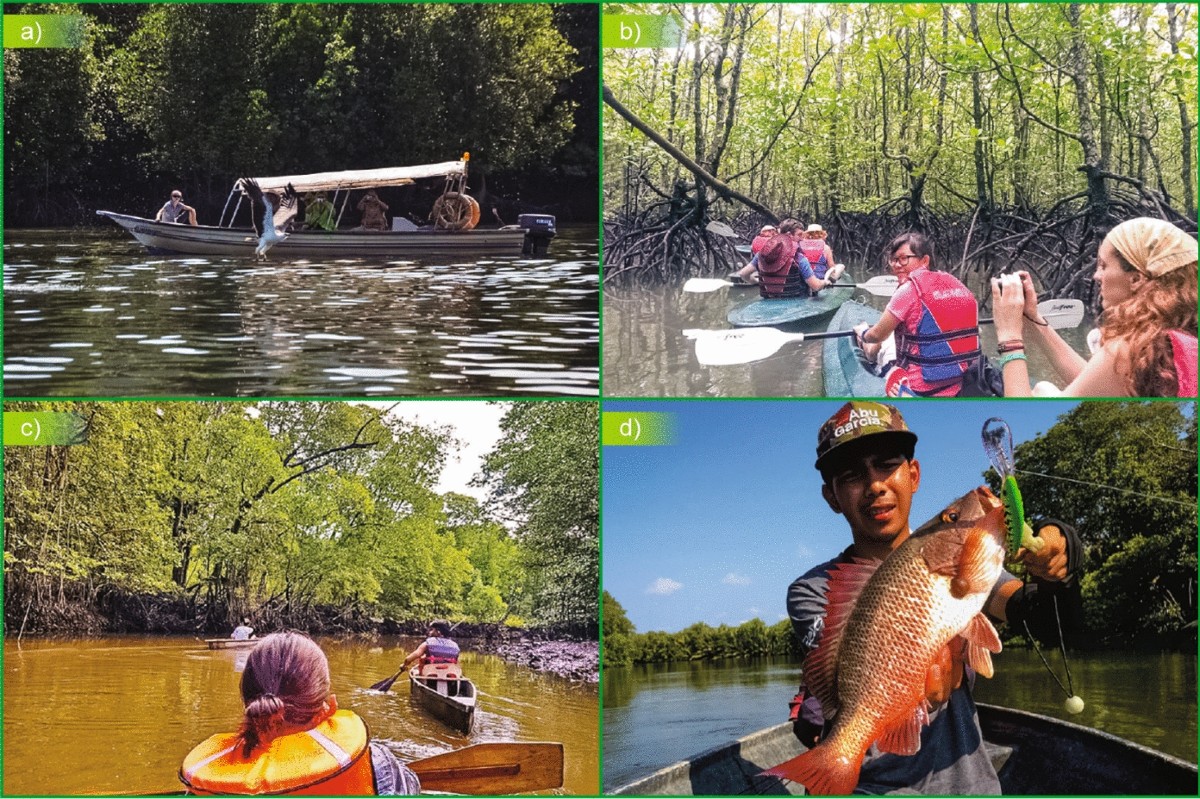
Conceptual Synthesis of Malaysian Mangrove Biodiversity, Carbon Storage & Threats
Synthesis of carbon sequestration capacity, artisanal fishery support, aquaculture encroachment, and coastal management strategies in Malaysia.
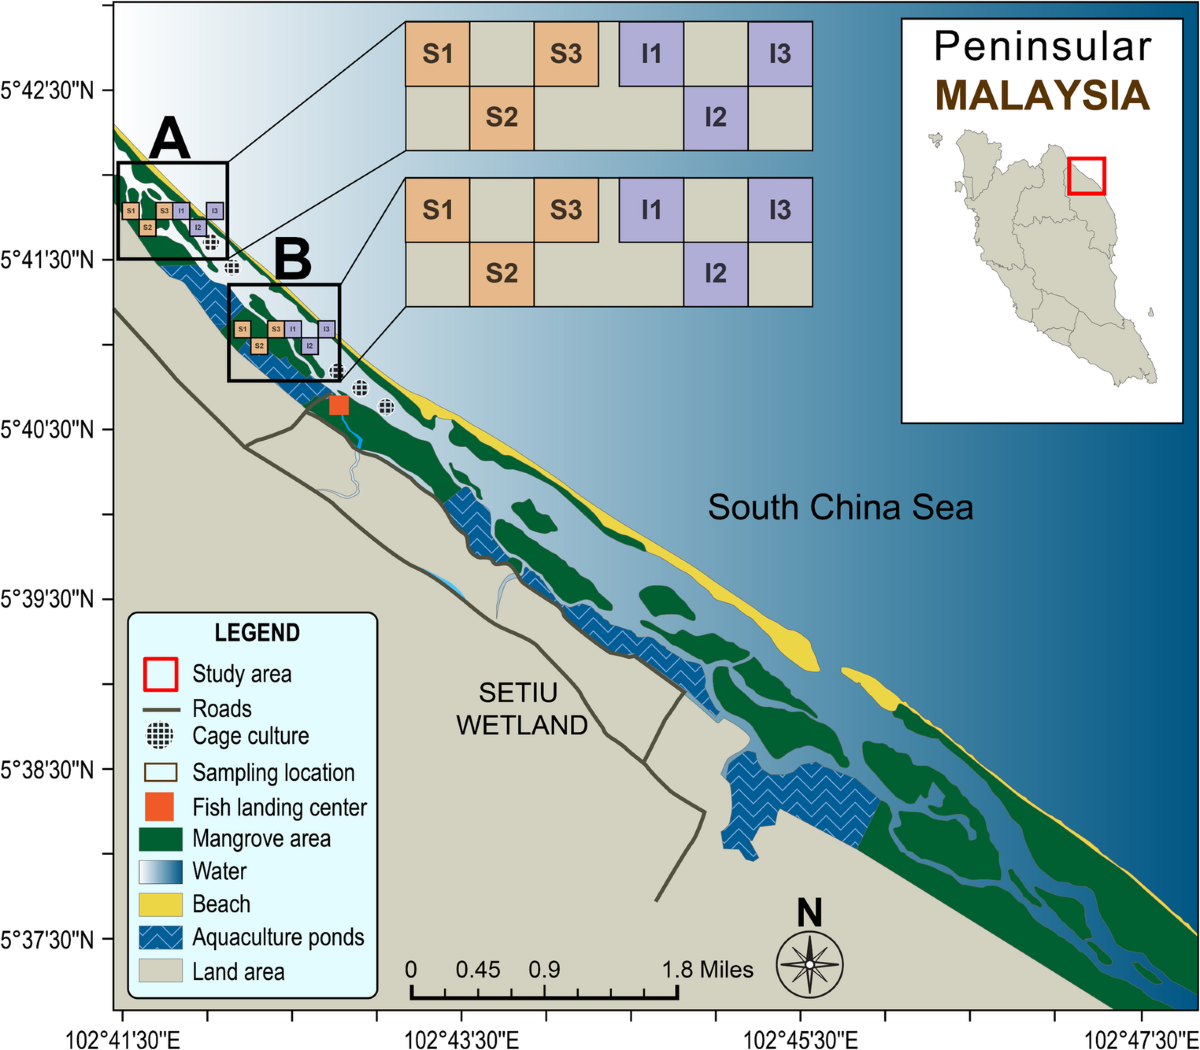
Aboveground Biomass & Sediment Carbon Stocks in Setiu Lagoon Mangrove Islands
High-resolution field mapping of mangrove islands and estuarine sampling stations in Setiu Wetlands, Terengganu, Malaysia.
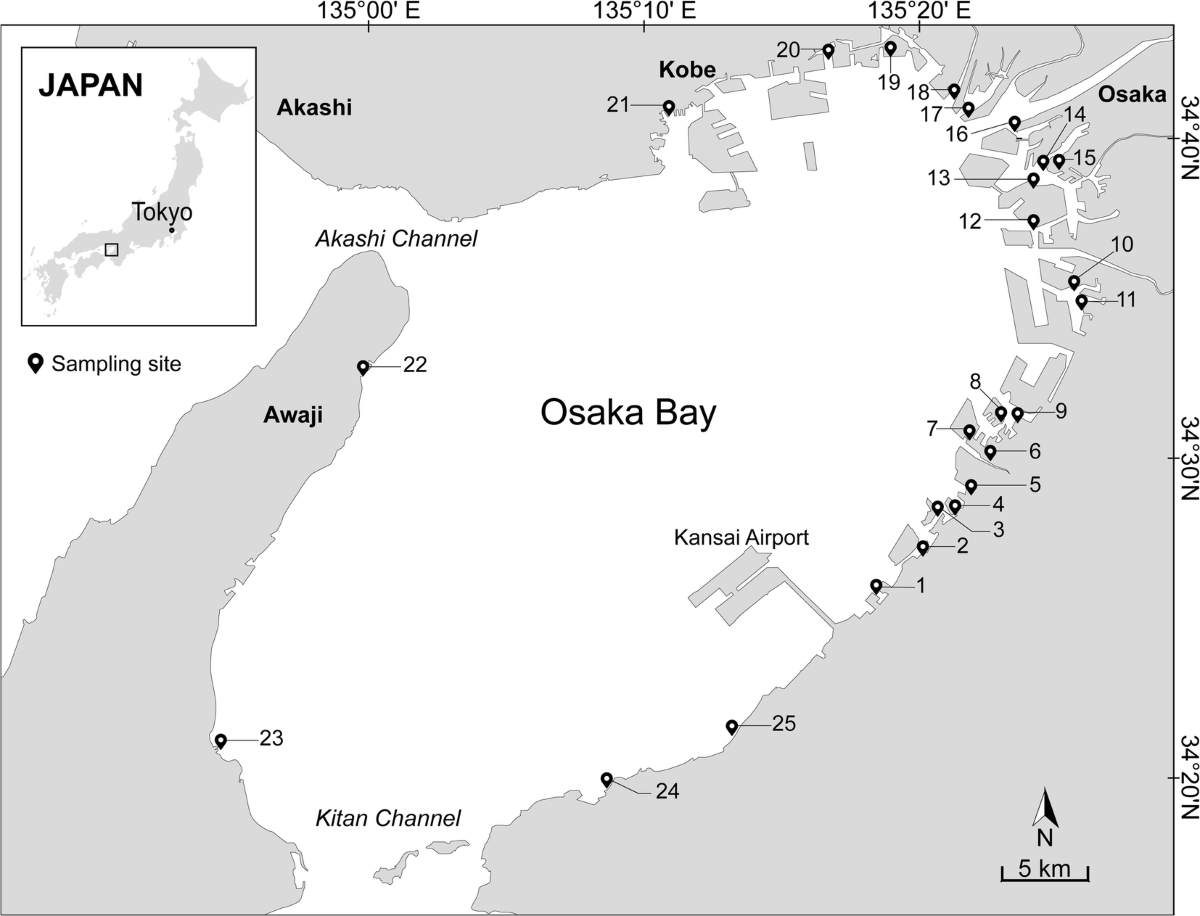
25-Station Surface Sediment Geochemical Sampling Network in Osaka Bay, Japan
Sampling stations across urban and industrial coastal zones of Osaka Bay analyzed for 5-step sequential extraction of Cd, Cu, Pb, and Zn during Dr. Billah's Ph.D. at Kagoshima University.
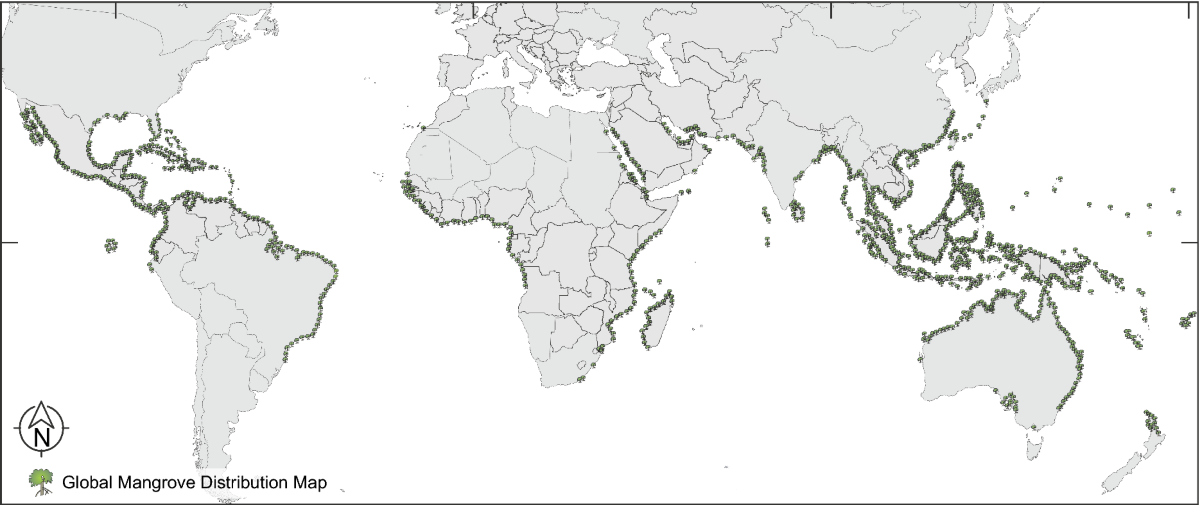
Sources, Trophic Bioaccumulation & Microbial Bioremediation of PAHs in Mangroves
Mechanistic diagram of Polycyclic Aromatic Hydrocarbon (PAH) inputs, root-zone rhizosphere sequestration, and bacterial/fungal degradation pathways in tropical mangrove wetlands (61+ citations).